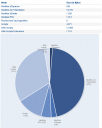
Every shared file server administrator has this problem: "who is taking most of the space?". This question is also a valid one for Alfresco administrators, but they do not have any easy tool to answer it. Adding this feature to Alfresco isn't very hard but for those who prefer reusing the others work, I will present a piece of Freemarker template doing it. This template will be also a good way to introduce interesting Alfresco Freemarker use.
First, here is a preview of the final result.

I will present the template file in two steps:
- Showing a table with the current space children and their total size
- Showing the same information as a pie chart
STEP 1: Showing the table
First of all, having a function returning the total size of a space is necessary. This function will have to recurse over the whole hierarchy to compute the real size of the space. The following piece of Freemarker code defines this function and can be called either on a container or on a leaf of the tree.
<#function getSize node>
<#assign sum = 0/>
<#if node.children?size = 0>
<#assign sum = node.size/>
<#else>
<#list node.children as child>
<#assign sum = sum + getSize(child)/>
<!--#list-->
<!--#if-->
<#return sum />
<!--#function-->
Now that the function computing a node's real size is written, the template showing the table is easy to do. Here is a way to do it like the screenshot. The only noticeable point in this code could be the way to alternate the CSS class for the data rows.
<table class="recordSet" border="0" cellspacing="0" cellpadding="0" width="100%">
    <tbody>
        <tr>
            <th class="recordSetHeader" style="padding: 2px; text-align: left;">Node</th>
            <th class="recordSetHeader" style="padding: 2px; text-align: left;">Size (in Byte)</th>
        </tr>
        <#if document?exists>
        <tr class="recordSetRow">
            <td>${document.name}</td>
            <td>${getSize(document)}</td>
        </tr>
        <#else>
        <#assign i = 0/>
        <#list space.children as child>
        <tr class="${(i % 2 = 0)?string(">
            <td style="padding: 2px; text-align: left;">${child.name}</td>
            <td style="padding: 2px; text-align: left;">${getSize(child)}</td>
        </tr>
        <#assign i = i + 1 />
        <!--#list-->
        <!--#if-->
    </tbody>
</table>
STEP 2: Showing the pie chart
To show a chart, an existing library for charts creation will be necessary. I have chosen to use PlotKit Javascript library. This library depends on the MochiKit Javascript library. There is an example of chart with labels among the PlotKit examples to know how to create the pie chart with the children names as labels. The problem is that the JavaScript function used to create the chart will need the data and these ones can't be computed another time for obvious performance reasons.
The previously written function will have to be reused to produce the JavaScript function. In order to reuse the data for both the chart and the table, the data have to be put in a Freemarker sequence. But as creating an empty Freemarker sequence and fill it in a loop doesn't seem to be possible, the only solution is to create the Freemarker definition of the sequence and evaluate it. Here is how to do it:
<#assign ftlArray = "["/>
<#if document?exists>
    <#assign ftlArray = "[["" + document.name + ""," + getSize(document)?c + "]]"/>
<#else>
    <#assign first = true />
    <#list space.children as child>
        <#if first = false>
            <#assign ftlArray = ftlArray + ","/>
        <!--#if-->
        <#assign ftlArray = ftlArray + "["" + child.name + ""," + getSize(child)?c + "]" />
        <#assign first = false/>
    <!--#list-->
    <#assign ftlArray = ftlArray + "]"/>
<!--#if-->

<#assign values = ftlArray?eval/>
After this Freemarker code, the values variable will contain the data
as a sequence of sequences. The JavaScript function to add in the
template and the HTML tag for the chart rendering are done in the
following way. For it to work, the files provided in the lib/MochiKit
directory of the MochiKit distribution and the files found in the
PlotKit directory of the MochiKit distribution have to be placed in
/scripts/mochikit and /scripts/plotkit in the alfresco WAR.
<script src="/alfresco/scripts/mochikit/MochiKit.js" type="text/javascript"><!--mce:0--></script>
<script src="/alfresco/scripts/plotkit/excanvas.js" type="text/javascript"><!--mce:1--></script>
<script src="/alfresco/scripts/plotkit/Base.js" type="text/javascript"><!--mce:2--></script>
<script src="/alfresco/scripts/plotkit/Layout.js" type="text/javascript"><!--mce:3--></script>
<script src="/alfresco/scripts/plotkit/Canvas.js" type="text/javascript"><!--mce:4--></script>
<script src="/alfresco/scripts/plotkit/SweetCanvas.js" type="text/javascript"><!--mce:5--></script>

<script type="text/javascript"><!--mce:6--></script>
The chart will be rendered in the canvas element. The code shown in the
first step for the table printing has to be adapted to use the values
variable instead of using directly the getSize() function.
In order to use the template, place it in the
Data Dictionary/Presentation Templates space in Alfresco. Then simply
apply the template on the space for which to get the table and chart.
Here are some useful links to create more templates like this one for Alfresco: