I haven't provided any update of the LibreOffice contributions stats until the end of October... but I am about to fix that in this post. Like before the stats have been generated using gitdm and its configuration located in this git repo. Here are the same two graphs updated (the file with the data can be found here). Here are a few points to understand the graphs:
- The activity cut that can be seen at the end of 2010 is mostly due to the fact that loads of developers were away celebrate Christmas and the end of the year. The other fact explaining this is that almost all the remaining developers were working hard to make 3.3 out.
- The data are extracted from the master branch of all the LibreOffice git repositories. Then all the work happening in features branches that has still not be merged can't be revealed here.
- The formula to compute the line changes has been changed... instead of adding the deleted and added lines, I'm now showing the maximum of these two values. There is no real way to extract accurate data for this, but it provides more meaningful figures.
- Did you see that Canonical is now contributing code? Welcome to Björn Michaelsen in the LibreOffice community!
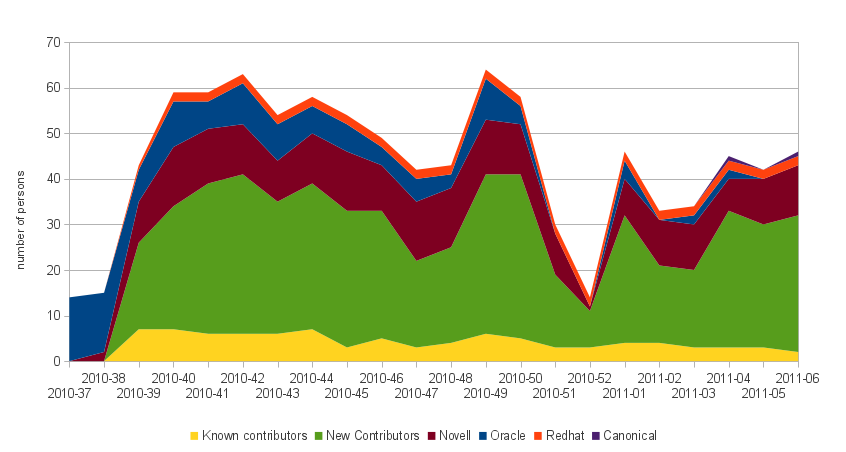
Contributors to LibreOffice per week
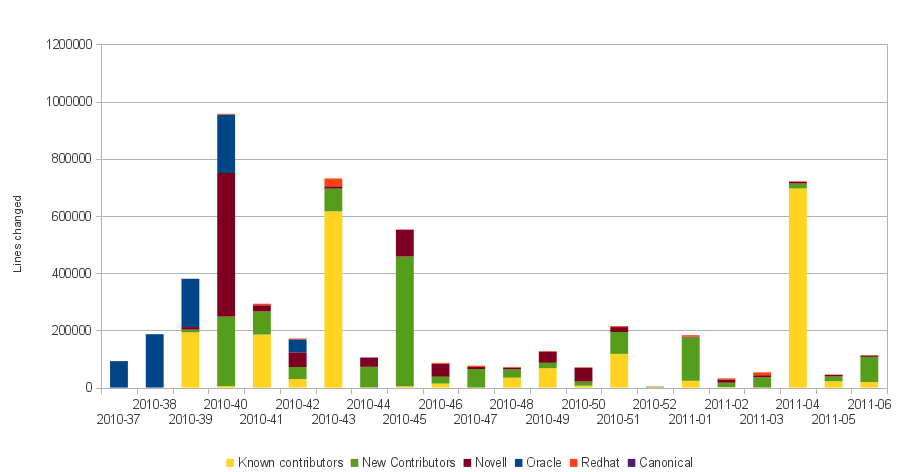
Lines changed on LibreOffice per week
LibreOffice now counts 133 new hackers and 55 localizers (since the fork). Let's hope that there figures will increase according to the number of persons attending LibreOffice development talks at FOSDEM.