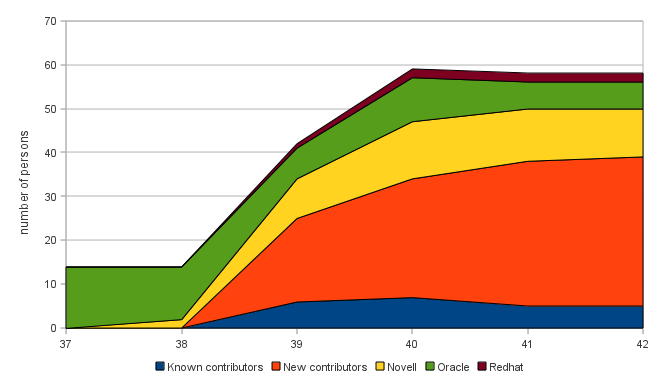
We had a really important amount of new contributions, but people tends to prefer figures to see it. I used the git repositories logs and gitdm to get the data and produce some graphs showing the intense activity around LibreOffice. The gitdm configuration and scripts to extract the data can be found on freedesktop.org. The first graph is showing the number of contributors increasing each week. There are a few interesting points to note:
- The number of new contributors grew quickly. The graph don't show it, but there are now more than 60 new contributors.
- The contributors counted in this graph are either developers or people working on localization.
- Oracle is contributing: LibreOffice merges OpenOffice.org changes.
Contributors by week graph
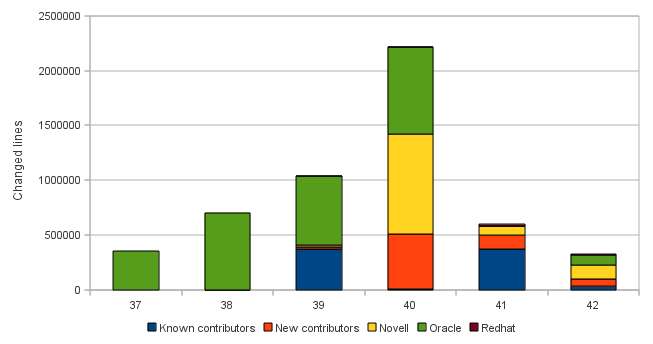
The second graph show the number of changed lines over the past few weeks. These data are based on the number of added and removed lines of the git commit diffs. Having a relevant number of changed lines is pretty hard. Thus I decided to sum the number of added and removed lines: this provides fair data, even though the big numbers aren't really meaningful. To read these values, we need to keep in mind the following points:
- Adding the mode lines for emacs and vim generated a lot of added lines
- Cleaning up the header guards also generated a lot of lines removed: the script to remove them has been written by a new contributor and has been run by Petr Mladek
- Changing a single tiny thing in a line adds one added and one removed line.
Changes by week graph
The gitdm stats on po and sdf files are reporting 34 persons (27 new contributors) working on the localization... though I'm counted in them due to a small typo fixed in a po file. Among the new contributors working on localization, there are probably person who worked or are working on the OpenOffice.org project.
Here are the full data in CSV format and with the graphs in ODS. The full data for the localization can be found here.
Many thanks to all of the contributors, newcomers and others!

